Industry News
Curation by industry experts
Hot Articles
Popular Tags
How test temperature affects insulation thermal performance ratings
Test temperature can change an insulation material’s measured thermal conductivity enough to alter a product comparison or a heat-loss calculation. A published R-value therefore needs a temperature context: two products with similar ratings at one laboratory condition may provide different thermal resistance in a freezer wall, a sun-heated roof, or insulation around a hot process line.
For technical evaluation, the first distinction is between mean specimen temperature and the temperature difference across the specimen. Mean temperature identifies the thermal conditions at which conductivity is measured; the temperature difference establishes the gradient driving heat flow. Both matter, but they do different jobs. A defensible comparison uses results obtained under compatible conditions and checks whether those conditions represent the intended service.
Which temperature does a thermal rating represent?
In a steady-state test of a flat insulation specimen, the apparatus establishes a hot face and a cold face. The mean test temperature is commonly expressed as the arithmetic average of those two surface temperatures:
T
Mean temperature = (hot-face temperature + cold-face temperature) / 2
Temperature difference = hot-face temperature − cold-face temperature
For example, specimen faces held at 35°C and 15°C produce a mean temperature of 25°C and a temperature difference of 20 K. Faces held at 45°C and 5°C have the same mean temperature but a difference of 40 K. These are illustrative test conditions, not prescribed settings for every method or product.
The distinction prevents a common selection error: using ambient temperature, room temperature, or process-fluid temperature as though it were the temperature of the entire insulation layer. An insulation layer spans a temperature range. Its surface temperatures also depend on convection, radiation, coverings, and the surrounding construction.
For a homogeneous flat layer under approximately one-dimensional conduction, thermal resistance per unit area is related to thickness and thermal conductivity:
R = thickness / thermal conductivity
With thickness in metres and conductivity in W/(m·K), R is expressed in m²·K/W. At unchanged thickness, an increase in conductivity reduces resistance. As a purely mathematical example, a 10% increase in conductivity reduces R by about 9%, because resistance varies inversely with conductivity. That relationship does not predict how much any particular product’s conductivity will change with temperature.
Also check the unit system. A numerical R-value expressed in US customary units cannot be compared directly with one expressed in SI units. Before considering temperature effects, establish that the reported quantities, thicknesses, and units are equivalent.
Why conductivity changes—and why products can change differently
Insulation transfers heat through several interacting mechanisms. Heat travels through the solid structure and through gases within pores or cells; radiation can contribute across internal spaces. Some structures and conditions can also permit gas movement. Temperature changes the relative contribution of these mechanisms, so effective thermal conductivity is a property of the material under defined conditions.
For many fibrous and cellular products, conductivity rises over parts of their operating range as temperature increases. Gas conduction and radiative transfer can contribute to that rise. However, a single linear correction should not be applied across all insulation types or across a broad temperature range. Density, fibre arrangement, cell structure, gas composition, and infrared absorption influence the response.
Closed-cell foams require particular care. Their thermal behavior depends partly on the gases inside the cells, and those gases can change with aging. Some foam formulations can also show nonlinear behavior at low temperatures, including effects associated with changes in the physical state of cell gases. A room-temperature result cannot establish the shape of the conductivity curve in cold service.
Consequently, a material that leads a comparison at one temperature may lose some or all of that advantage elsewhere. The possibility matters most when the difference between products is small, the service temperature is far from the rating condition, or the application spans a broad temperature range. Product-specific measurements are needed to establish whether a ranking actually changes.
Moisture and temperature should also be evaluated together. A dry specimen tested at a low temperature describes dry-material behavior at that condition. It does not demonstrate the performance of insulation containing condensed water or ice. In cold-chain construction, vapor control, joints, and penetrations influence whether the installed material remains close to the condition represented by its laboratory rating.
A temperature-dependent conductivity curve is therefore more useful than a single value when selecting insulation for demanding thermal conditions. The curve should identify specimen condition, density, thickness, aging treatment where relevant, and the measured temperature range. Smooth curves without those details can imply more certainty than the underlying evidence supports.
Why the temperature difference also deserves attention
Two tests at the same mean temperature do not necessarily expose the specimen to equivalent conditions. Increasing the temperature difference widens the temperature range within the material. If conductivity varies substantially across that range, the reported result represents an effective response across the gradient.
For a homogeneous flat layer with steady one-dimensional conduction and conductivity that depends only on temperature, effective conductivity corresponds to conductivity averaged across the temperature interval. Where the conductivity curve is approximately linear, the value at the mean temperature may provide a useful approximation. Strong curvature or a transition within the interval can make that approximation less reliable.
This is particularly relevant when extrapolating a modest laboratory gradient to a large service gradient. A low-temperature surface on one side and a warm surface on the other can span conditions that a narrow-range test never examined. An arithmetic mean alone may conceal that limitation.
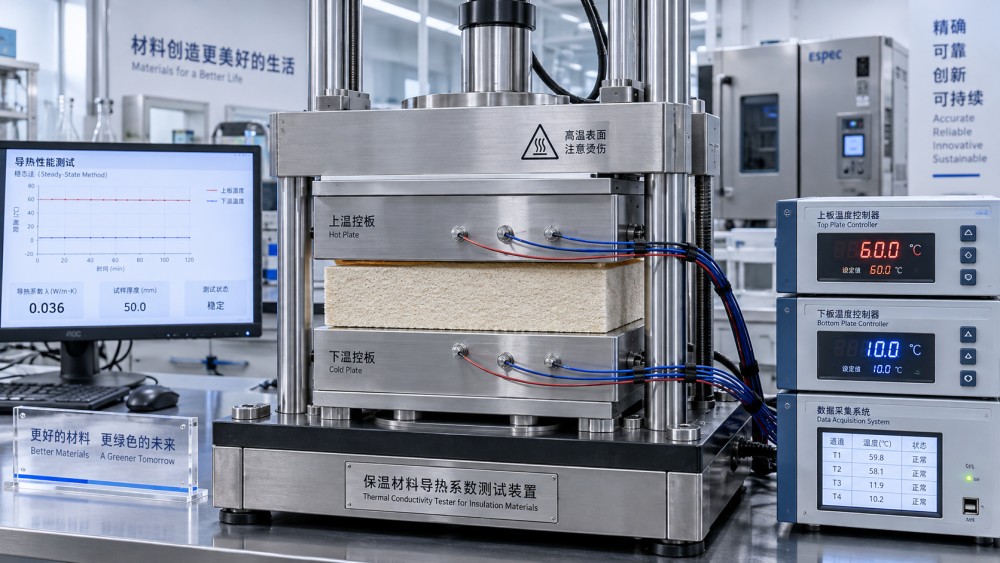
The imposed gradient also affects measurement quality. A small temperature difference produces a small heat-flow signal, increasing the relative importance of measurement uncertainty. A large difference can make edge losses, unwanted heat paths, or other apparatus effects more consequential. Appropriate test methods control these factors within their operating scope; a larger gradient is not automatically a better test.
Specimen orientation can matter where internal convection is possible. Thickness and contact with the apparatus can also influence the measurement. When comparing insulation performance ratings, matching the mean temperature is a necessary starting point, but it does not establish equivalence by itself.
What ASTM, ISO, and EN methods actually establish
Test standards define how thermal measurements are made and how apparatus performance, specimen preparation, and reporting are controlled. They provide a basis for comparison. They do not make results taken at different temperatures, moisture states, or aging conditions interchangeable.
ASTM C177 covers steady-state heat-flux measurements and thermal transmission properties using a guarded hot plate. ASTM C518 uses a heat flow meter apparatus. Both are relevant to flat insulation specimens, but they use different measurement arrangements. Heat flow meter results depend on suitable calibration and operation within the apparatus’s validated range.
ISO 8302 addresses the guarded hot plate method, while ISO 8301 addresses the heat flow meter method. EN 12667 covers measurements using guarded hot plate and heat flow meter methods for products of high and medium thermal resistance. EN 12939 addresses thick products of high and medium thermal resistance. The applicable method depends on the specimen and the measurement requirements.
These method references should be read alongside the relevant product specification or declaration framework. A product standard can establish reference conditions, conditioning requirements, aging procedures, and rules for deriving declared values. A declared conductivity may therefore differ from the result measured on one specimen. A design value may incorporate further adjustments appropriate to the application.
ISO 10456 provides procedures relevant to declared and design thermal values for building materials and products, including conversion between conditions where applicable. Such conversion requires an appropriate basis. The existence of a conversion procedure does not justify applying a generic temperature coefficient to every insulation material.
Geometry introduces another boundary. Flat-board results support assessment of material properties, but heat flow through pipe insulation is radial. ASTM C335 addresses steady-state heat-transfer properties of pipe insulation. A pipe-system assessment should account for cylindrical geometry and boundary conditions when translating material data into heat loss or surface temperature.
A report stating only “tested to ASTM C518” leaves important questions unanswered. The evaluator still needs the specimen temperatures, thickness, conditioning, relevant calibration information, and reported uncertainty. Compliance with a recognized measurement method supports the evidence; the reported conditions determine whether that evidence answers the application question.
Applying laboratory results to the operating temperature range
Start with the temperatures expected at the insulation boundaries. For a building envelope, these may differ from indoor and outdoor air temperatures because of surface heat transfer and solar exposure. A single reference-temperature rating remains useful for standardized comparison, but seasonal energy calculations may need properties suited to the modeled conditions.
For hot industrial equipment, separate maximum service temperature from thermal performance at temperature. A product’s ability to tolerate a hot surface does not establish its conductivity there. Request thermal data spanning the expected insulation temperatures, and use the appropriate geometry when calculating heat loss. Mechanical integrity, shrinkage, and binder behavior remain separate suitability checks.
For chilled systems and cold storage, examine conductivity across the cold operating range and the warmer conditions near the outer surface. Where the objective is preventing condensation, the calculation also needs ambient humidity, surface heat transfer, and details of thermal bridges. A favorable dry conductivity value cannot establish condensation control for an assembly with discontinuous vapor protection.
Cryogenic applications require evidence suited to their much wider temperature span. Large extrapolations from building-temperature data are difficult to defend, especially where material behavior changes within that span. Assembly details and environmental conditions may also introduce heat-transfer paths absent from a flat-specimen test.
For multilayer constructions, temperatures at internal interfaces are part of the solution. Each layer’s resistance affects the temperature drop across it, and that temperature drop affects its conductivity. An iterative calculation may be needed when temperature dependence is significant. Assigning the same mean temperature to every layer can distort the result.
What to request before accepting a comparison
A useful technical submission makes the rating traceable to its conditions. For the proposed product and thickness, request:
- The measured quantity, units, test method, and specimen identification.
- Hot-face and cold-face temperatures, or mean temperature together with the imposed temperature difference.
- Conductivity or resistance data covering the intended temperature range.
- Specimen density, thickness, moisture conditioning, and aging status where relevant.
- Measurement uncertainty and an explanation of how measured results relate to declared or design values.
Then compare products at a common thickness and temperature basis, using a justified conversion or interpolation where necessary. Keep measured data distinguishable from extrapolated values. If the claimed advantage is similar in size to measurement uncertainty or to the adjustment between conditions, the ranking may not be robust enough to drive selection on thermal performance alone.
The decisive question is whether the rating supports the calculation being made. For a temperate building envelope, a standardized reference value may be an adequate starting point. For a freezer, a hot process line, or a construction spanning markedly different temperatures, the evidence should show how conductivity behaves across that range. Where the temperature curve is missing, obtaining that curve is the next useful step before turning a published R-value into a design assumption.
Recommended News
 VRF ControlVRF Control Systems for Campuses: Managing Multiple Buildings and ZonesVRF control systems for campuses simplify multi-building HVAC management. Explore integration, zoning, costs, and commissioning for a scalable system.Dr. Julian VoltNov 08, 2026
 Maglev ChillersChoosing Magnetic Levitation Chillers: Capacity and Part-Load EfficiencyChoosing Magnetic Levitation Chillers? Compare capacity, part-load efficiency and plant energy use to find the right fit for your facility.Dr. Julian VoltNov 07, 2026
 VRF ControlVRF System Quotation: What to Check Before Comparing Supplier BidsCompare every VRF system quotation with confidence. Learn how to assess capacity, installation scope, controls, warranties, and hidden costs before choosing a supplier.Dr. Julian VoltNov 06, 2026
 Maglev ChillersChoosing a Magnetic Levitation Chiller Exporter: Service and Warranty ChecksChoosing a magnetic levitation chiller exporter? Discover essential service, warranty, spare-parts, and commissioning checks to make a confident investment.Dr. Julian VoltNov 05, 2026